Create Abstract Art with p5.js: Animate the Sun and Waves

Hello and welcome back to another exciting tutorial! Today, we'll dive deeper into creative coding with p5.js and explore some fundamental programming concepts.
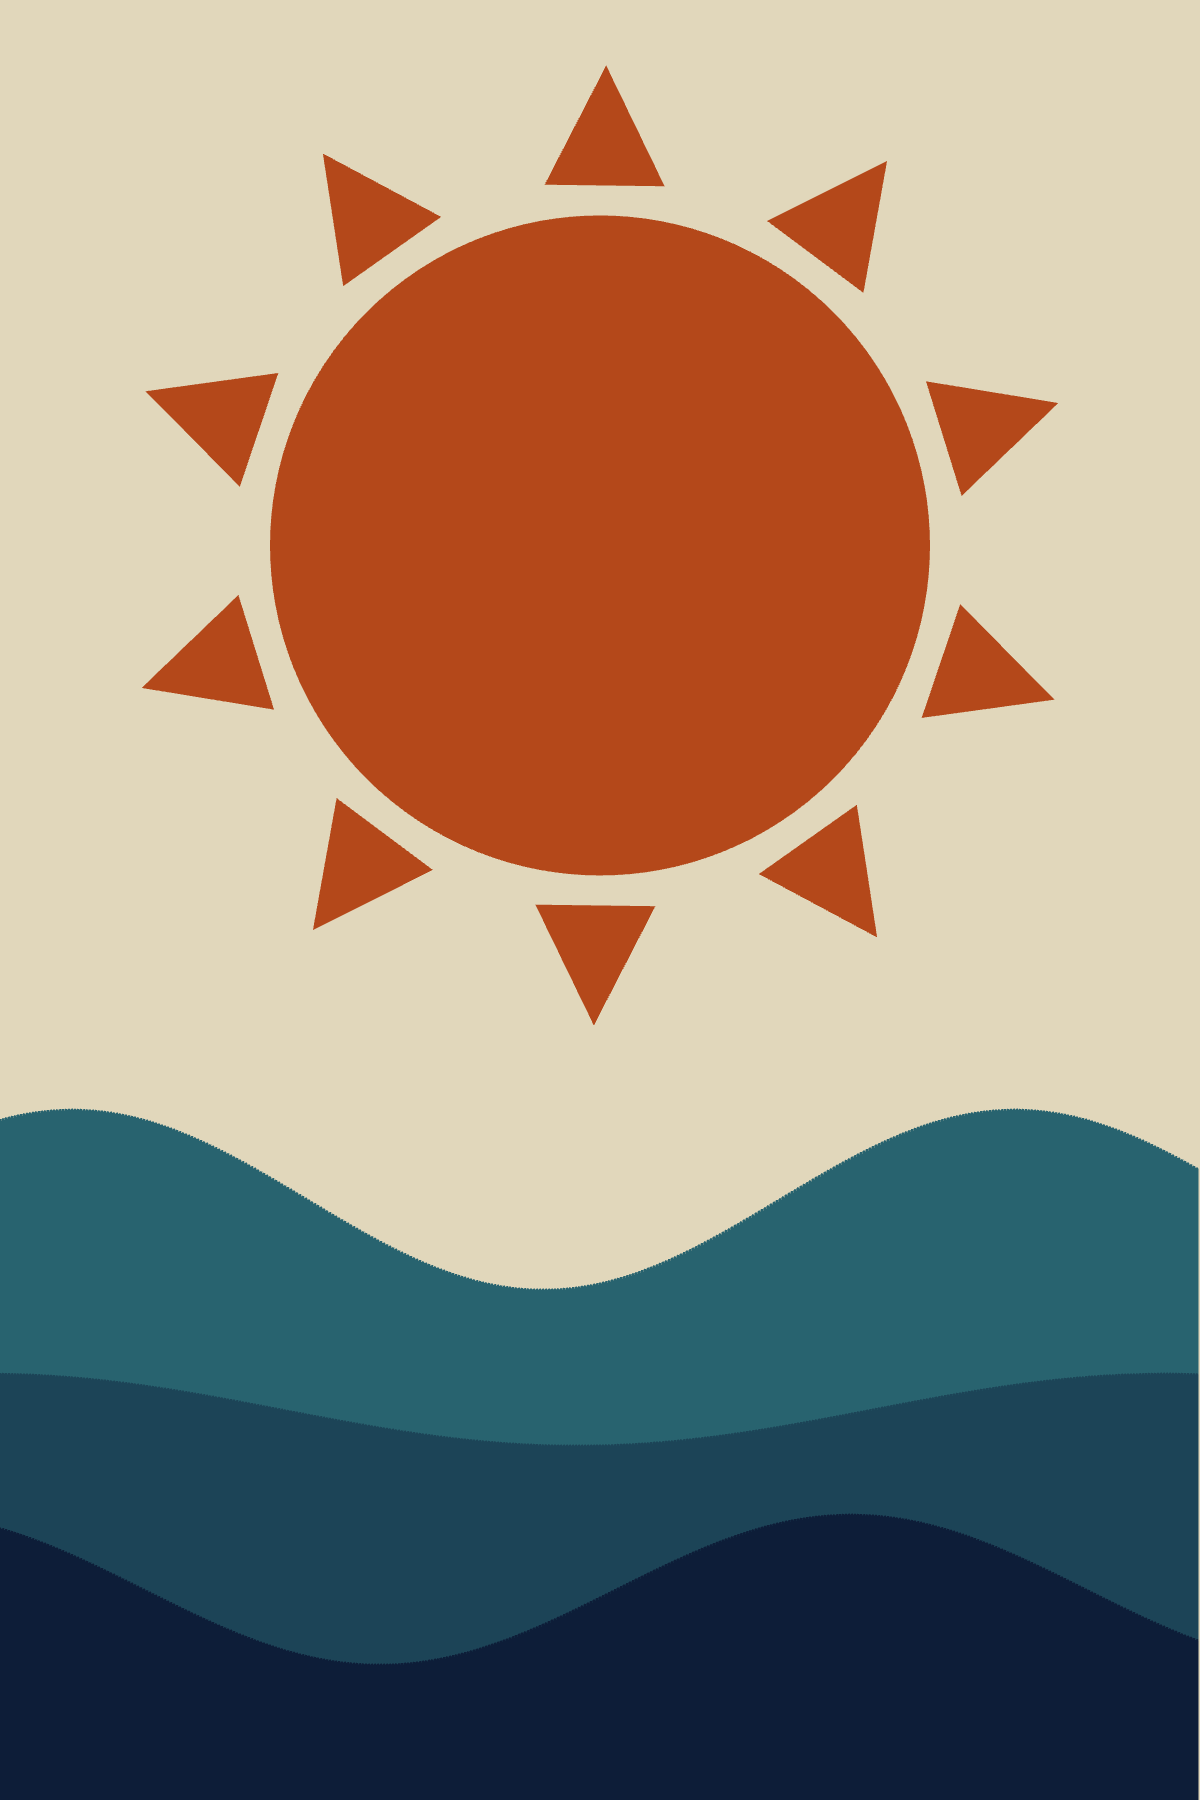
In this session, we'll create an abstract art piece featuring a sun and waves, and by the end, we'll animate both the sun and the waves to bring our artwork to life.
Identifying the Components
Let's start by identifying the components of our digital art. We'll have:
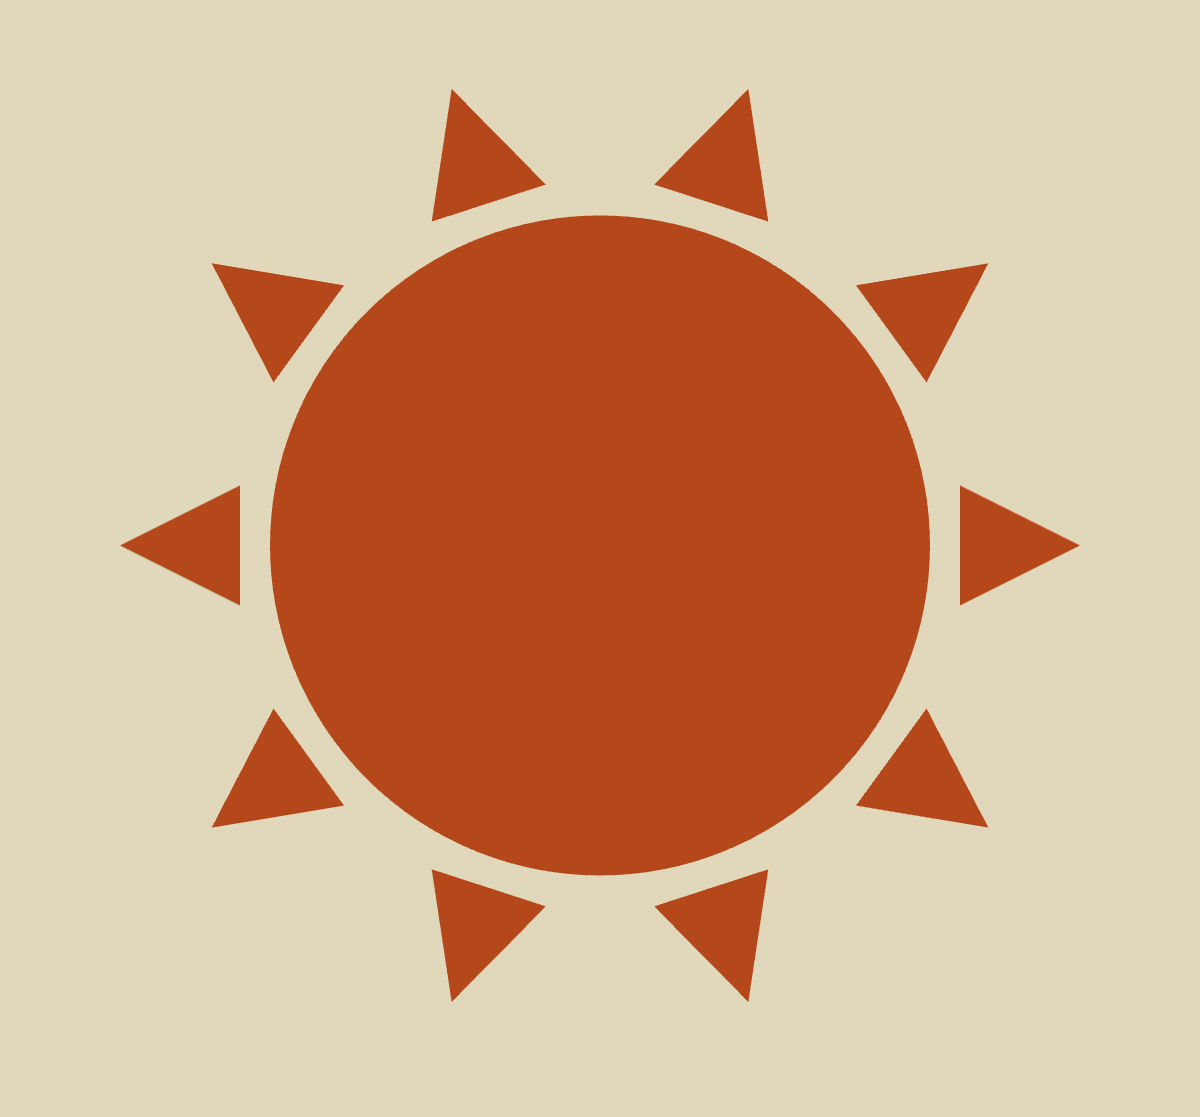
- A sun, represented by a circle with surrounding triangles rotated at different angles.
- Three waves, each with different colors and curves. Unlike the previous tutorial where we used noise to create waves, we'll use the sinusoidal (sin) function to draw more regular, repeating curves.
Setting Up the Canvas
Our setup function will create a canvas for our artwork:
function setup() {
  createCanvas(400, 600);
}
Drawing the Sun
First, we'll define a function to draw the sun. This function will take the x and y coordinates of the center and the radius as inputs. We'll disable the stroke and draw a circle filled with an orange color. Then, we'll use another function, drawSunRays, to draw the surrounding triangles.
function drawSun(centerX, centerY, radius) {
  noStroke();
  fill("#b4481a");
  circle(centerX, centerY, 220);

  let numberOfTriangles = 10;
  let distance = 140;
  let triangleSize = 20;
  drawSunRays(centerX, centerY, numberOfTriangles, distance, triangleSize);
}
Drawing the Sun Rays
We will explore a very powerful and elegant concept called polar coordinates.
By default, p5.js uses the Cartesian coordinates (x,y) to describe the position of a point in a 2d plane. In p5.js, the origin point is the top-left corner of the canvas which is described by the (0,0) coordinates and any other point (x,y) is described by the distance from the origin point on the x and y axis (horizontal and vertical axis).
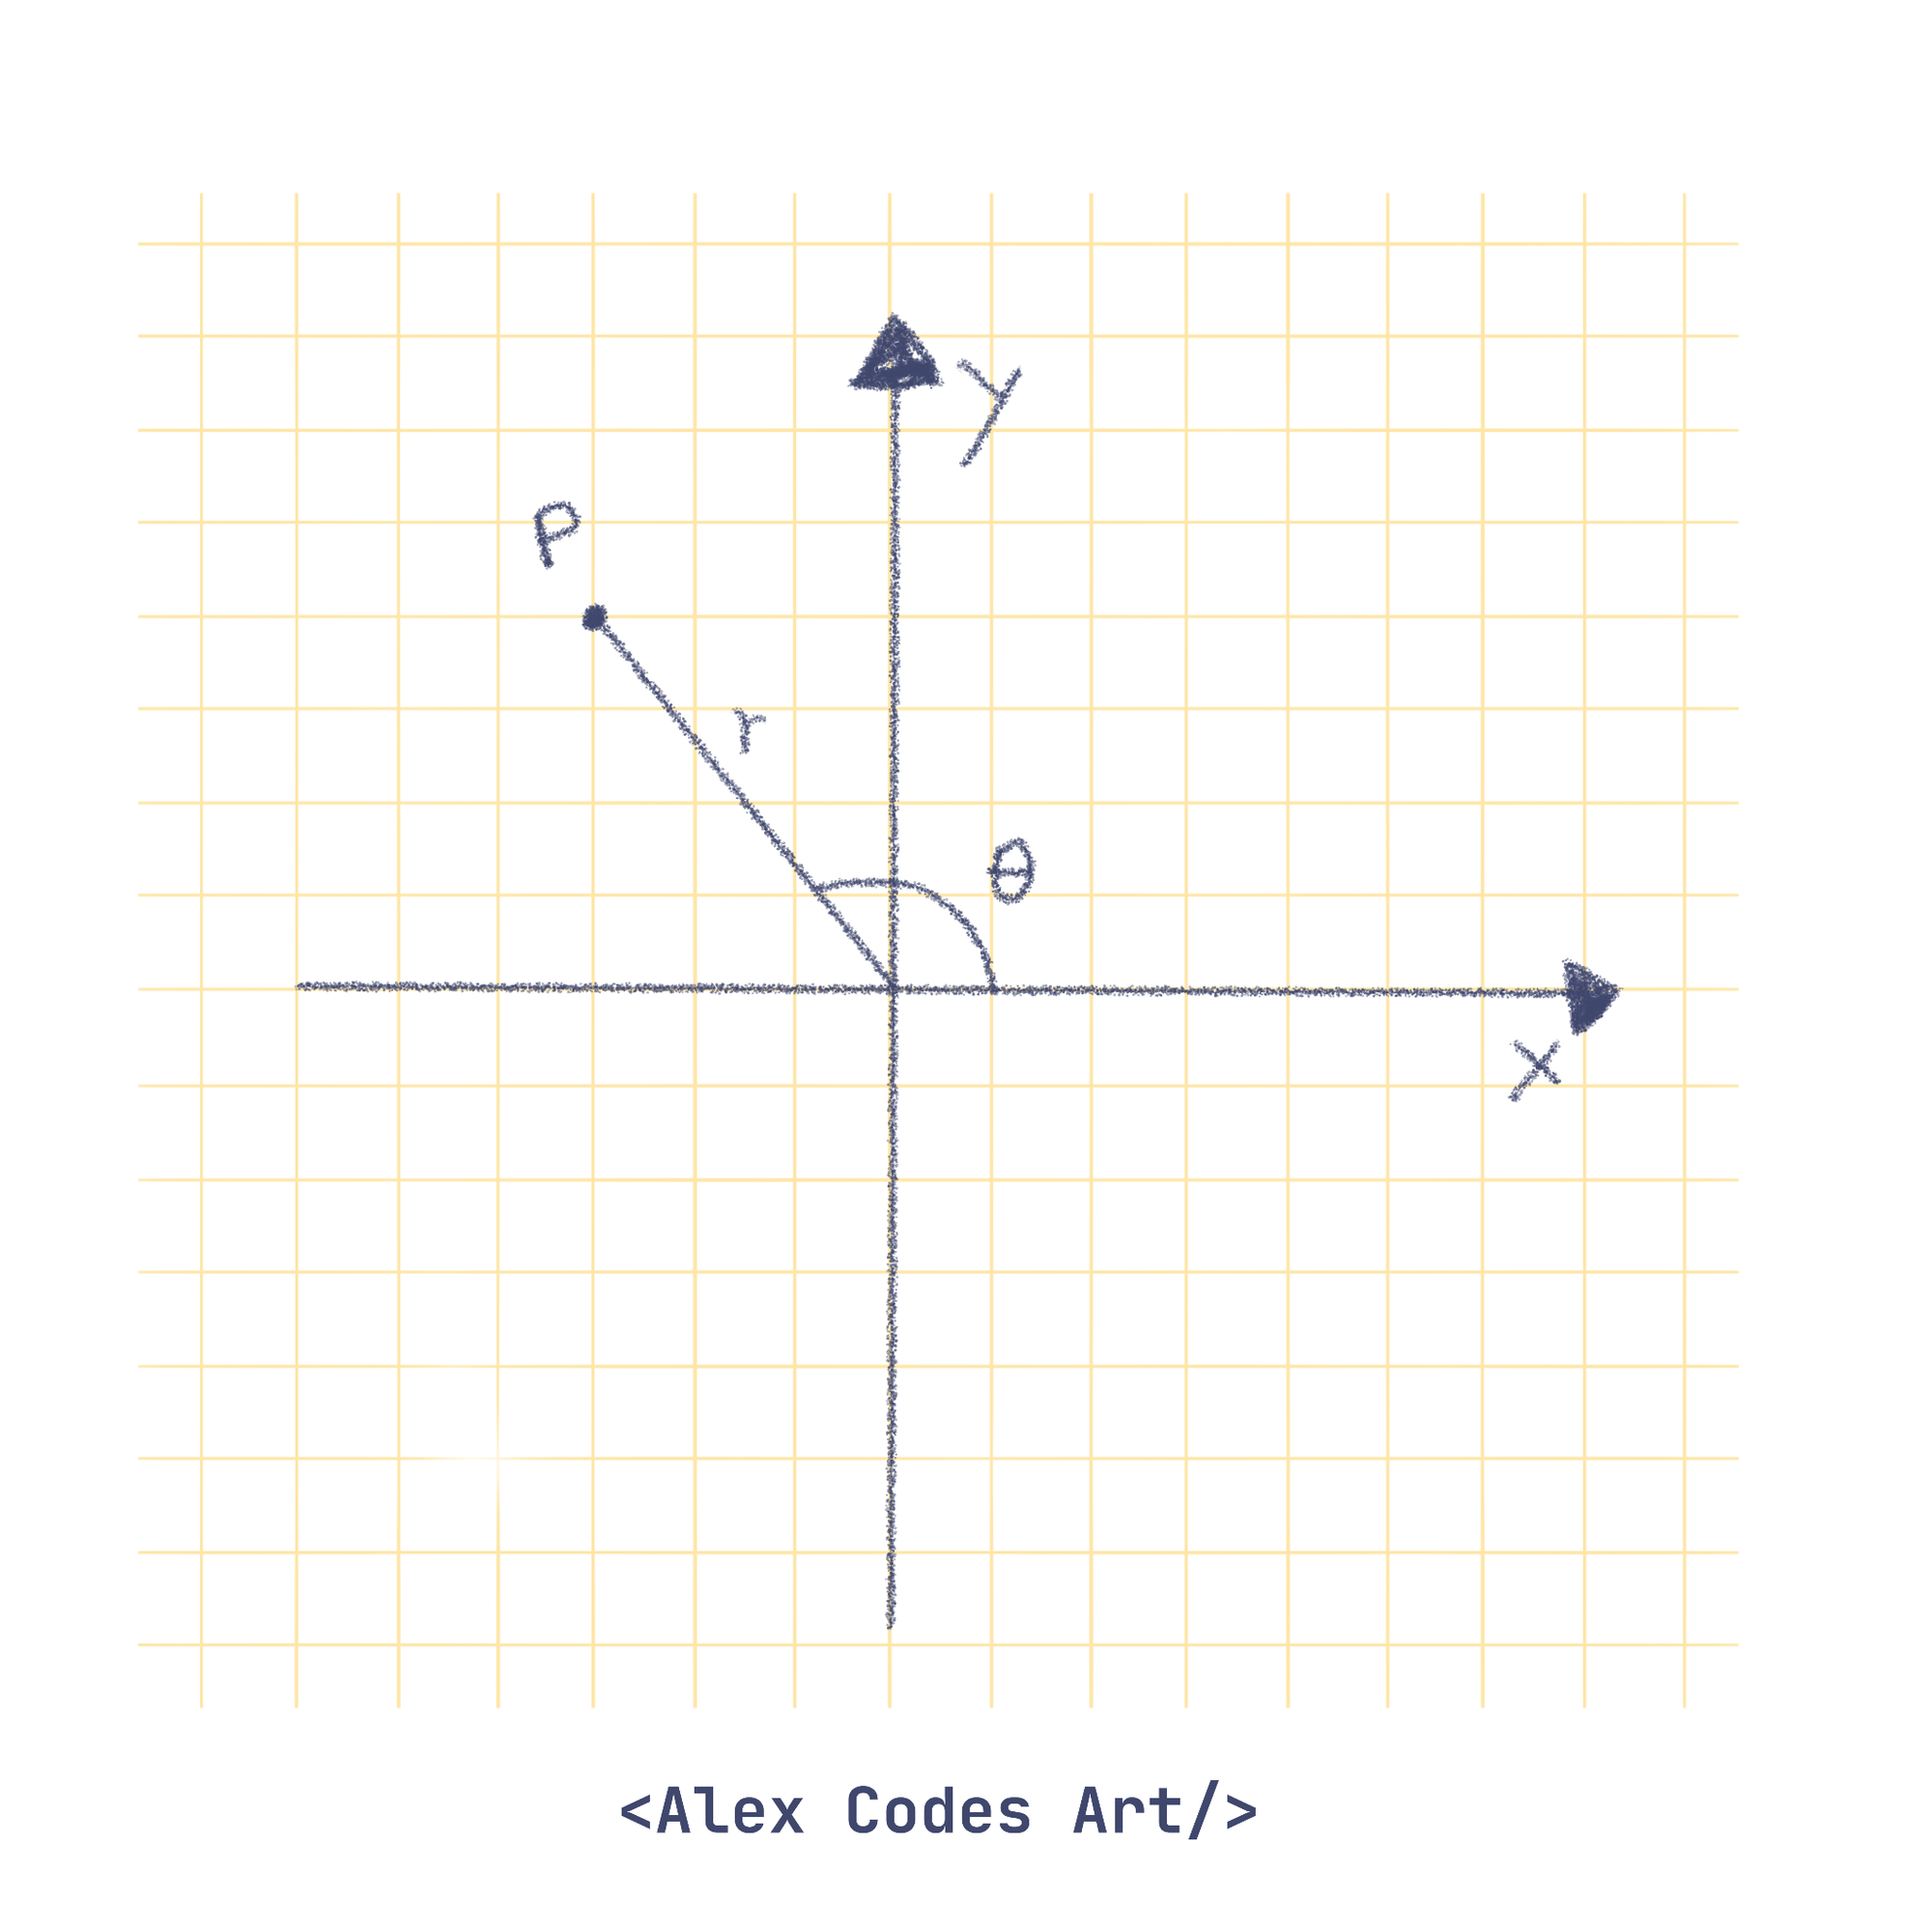
Another two-dimensional coordinate system is polar coordinates. Instead of using the signed distances along the two coordinate axes, polar coordinates specify the location of a point 𝑃 in the plane by its distance 𝑟 from the origin and the angle 𝜃 made between the line segment from the origin to 𝑃 and the positive 𝑥 axis.
The polar coordinates (r,θ) of a point P are illustrated in the below figure.
I will not dive deeper into the math of this but I encourage you to read more about it here. What we need to know is the formula to convert from cartesian to polar coordinates and those arex = r * cos(angle), y = r * sin(angle)
where r is the radius and angle is the angle with the x-axis.
The angle range is between 0 and 2 * PI. This represents 360 degrees. So let’s give it a try.
We'll start by drawing circles at these positions to verify our calculations:
function drawSunRays(centerX, centerY, numberOfTriangles, distance, triangleSize) {
  for (let i = 0; i < numberOfTriangles; i++) {
    let angle = map(i, 0, numberOfTriangles, 0, TWO_PI);
    let x = centerX + cos(angle) * distance;
    let y = centerY + sin(angle) * distance;

    circle(x, y, 10);
  }
}
We will iterate over every triangle we want to create and then we will map the number i between 0 and TWO_PI since that represents a full loop. Then, we apply the formulas to convert from cartesian to polar coordinates and draw circles instead of triangles, to test that what we have is correct. What we have now is this.
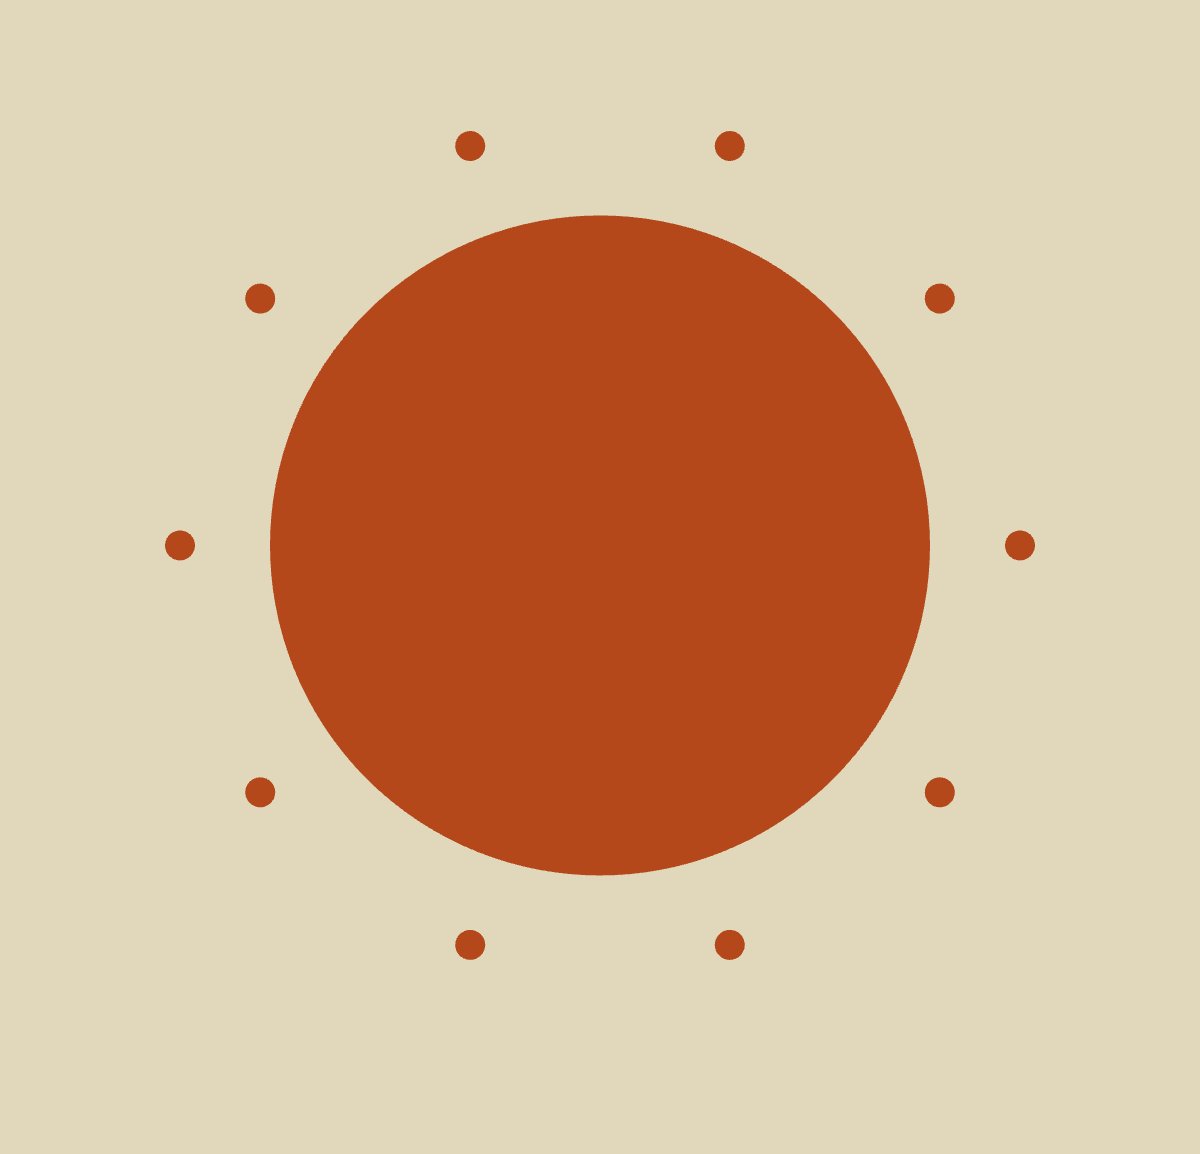
Math magic! Great work so far!
Replacing Circles with Triangles
The next step is to make those triangles instead of circles. The challenge comes from them having different rotations and for that, we will use the translate(), push(), and pop() functions from p5.js.
function drawSunRays(centerX, centerY, numberOfTriangles, distance, triangleSize) {
  for (let i = 0; i < numberOfTriangles; i++) {
    let angle = map(i, 0, numberOfTriangles, 0, TWO_PI);
    let x = centerX + cos(angle) * distance;
    let y = centerY + sin(angle) * distance;

    push();
    translate(x, y);
    rotate(angle + HALF_PI);
    triangle(-triangleSize, triangleSize, triangleSize, triangleSize, 0, -triangleSize);
    pop();
  }
}
The official explanation of the push and pop function is
Begins a drawing group that contains its own styles and transformations.
By default, styles such as fill() and transformations such as rotate() are applied to all drawing that follows. The push() and pop() functions can limit the effect of styles and transformations to a specific group of shapes, images, and text.
So, to limit the effect of translate() and rotate() to only one triangle, we wrap that code with push() and pop(). Then, we want to rotate the triangle but the rotate function rotates the objects around the origin point and you remember that the origin point of the canvas in p5js is the top-left corner and that is not useful since we want to rotate the triangle around his own center.
To do this, we call translate(x,y) which moves the origin point at those coordinates. Then calling the rotate function with the angle we calculated previously on which we add HALF_PI will give us exactly the result we want.
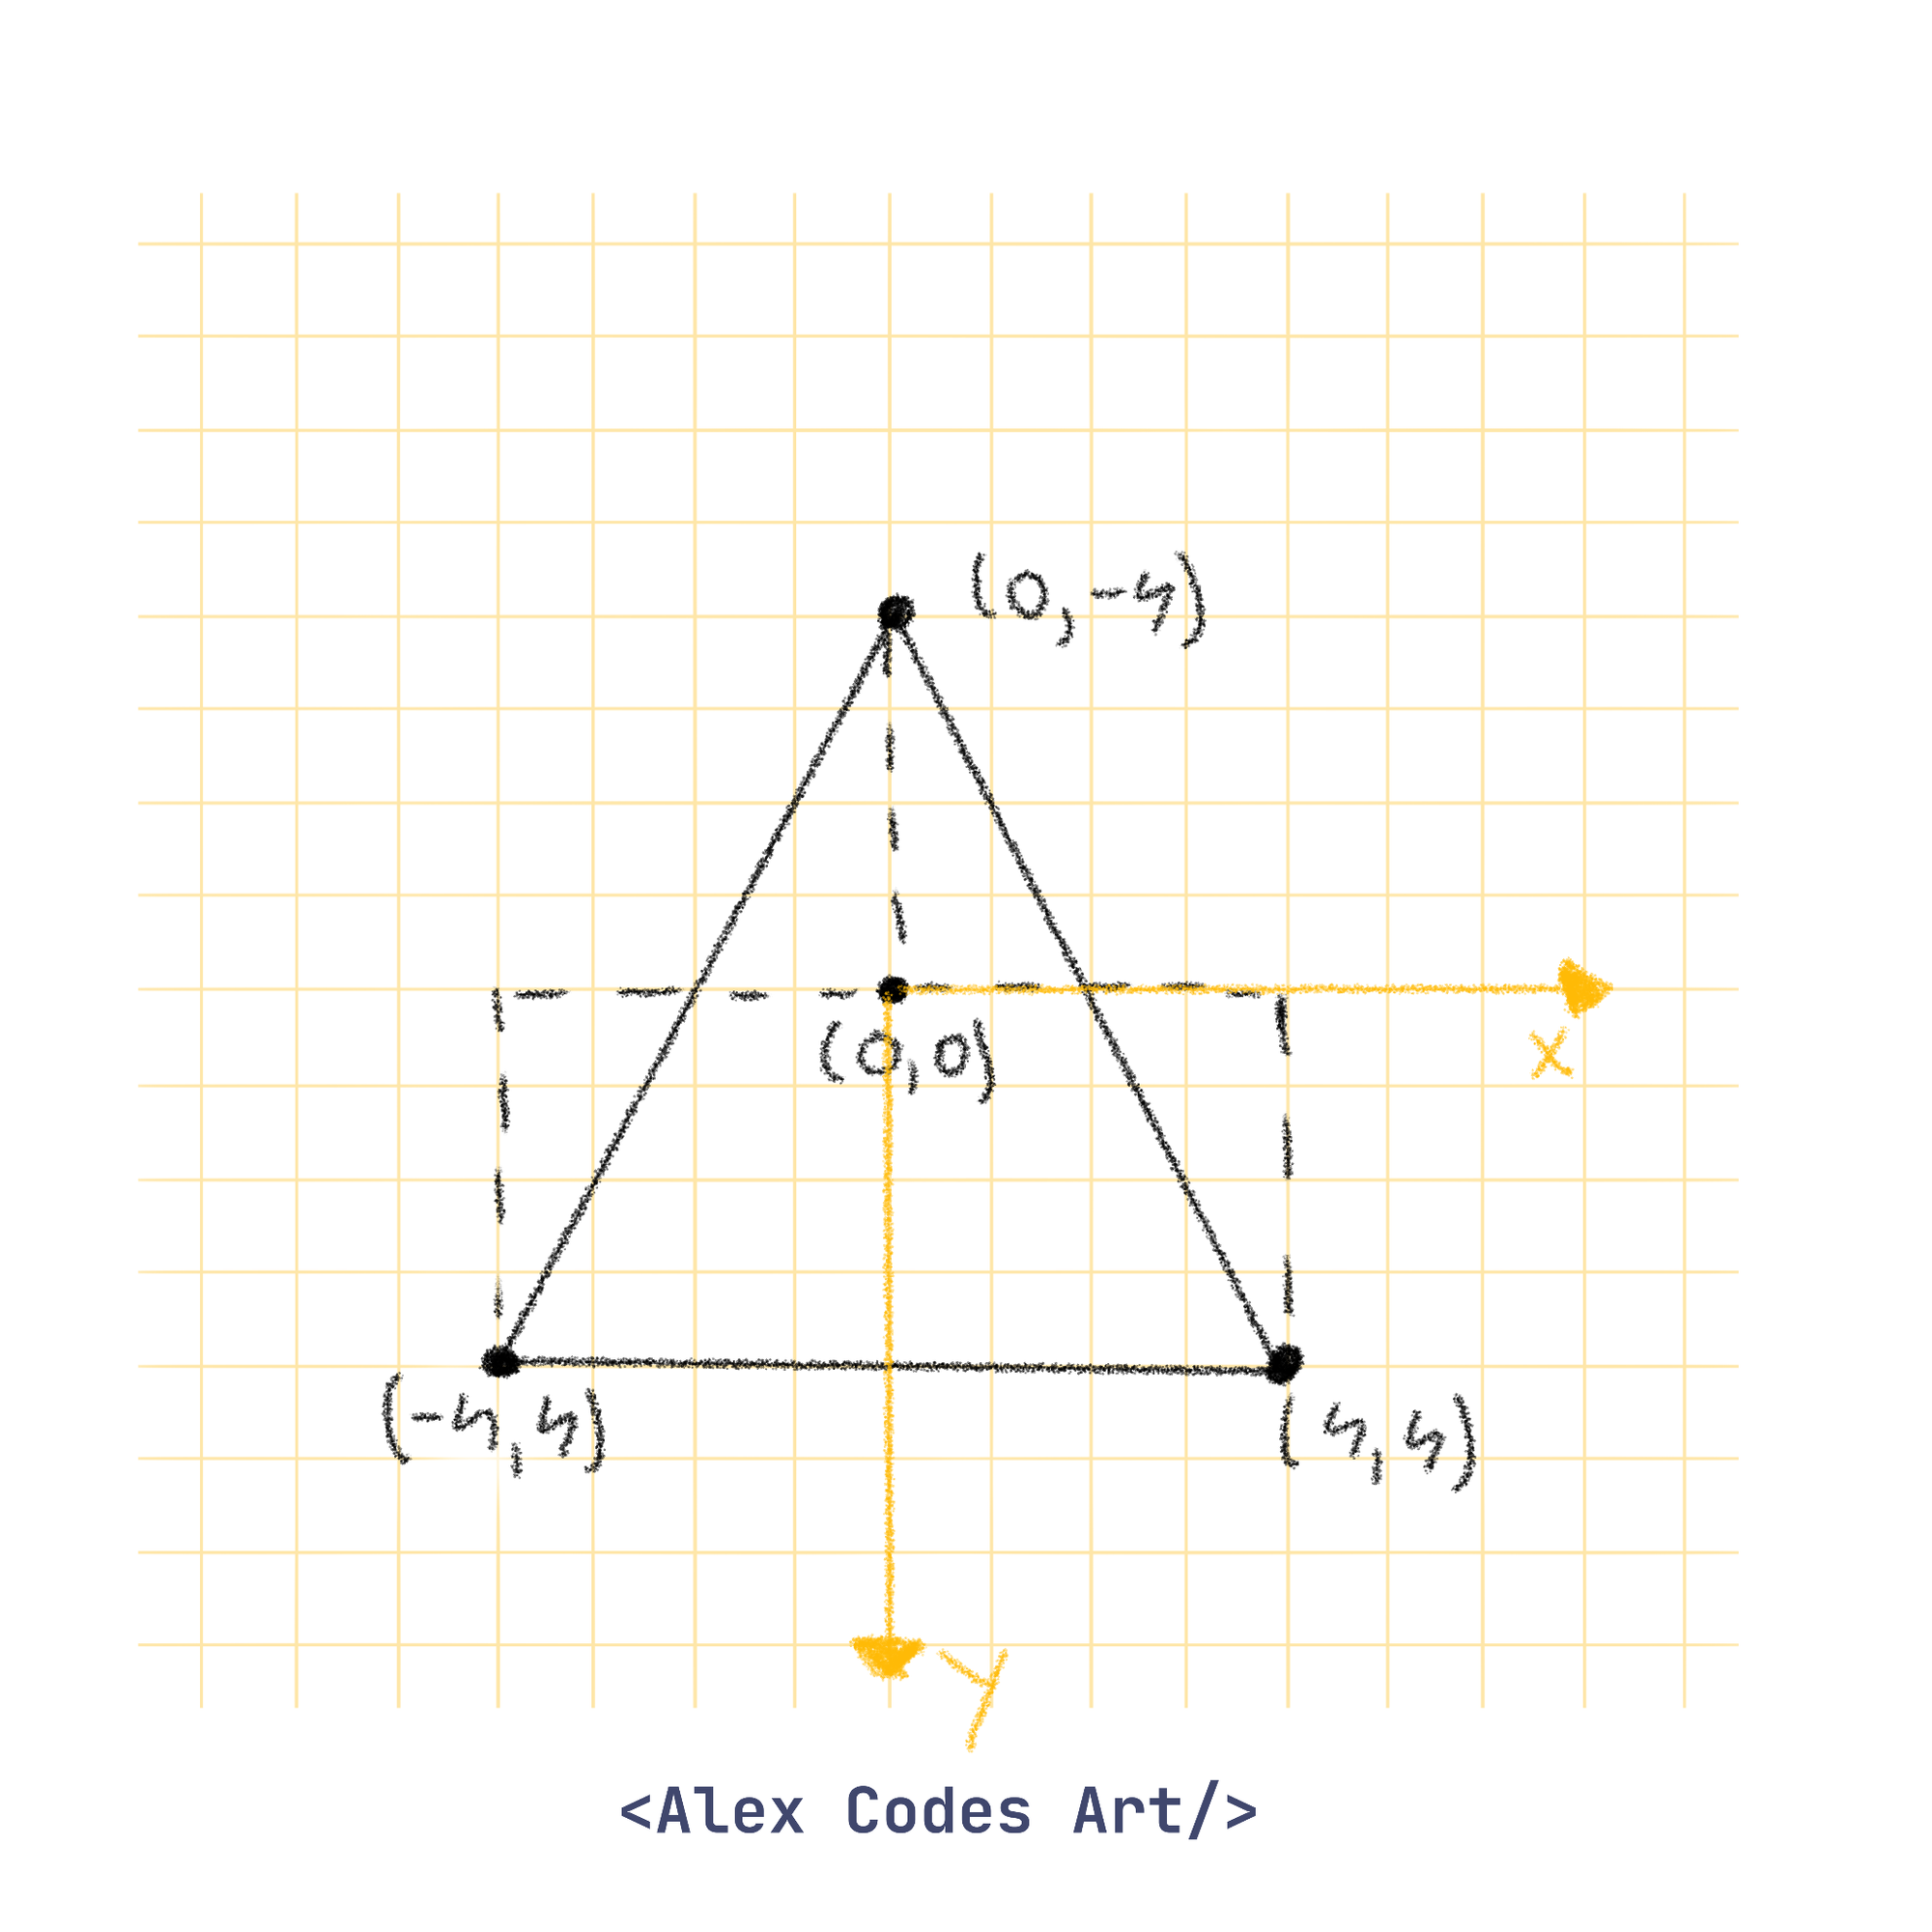
Then, the triangle() function accepts 6 parameters, which represent the x and y coordinates of the 3 points of the triangle.
Because we just moved the origin point to (x,y) by calling the translate(x,y), the call to the triangle function will use that as the origin when drawing it so the coordinates we pass are relative to the new origin point. Then, when we are done with drawing one triangle, we call pop() and this will remove the effects of translate and rotate so we can start again.
To better visualize how the triangle is getting drawn using those coordinates, here is a diagram, showing it for a triangle with size 4.
This is what we get now:
Drawing the Waves
Next, let's draw the waves. We'll create a generic function drawWave that takes the color, height, period, and amplitude as parameters. This function will draw lines from the left to the right of the canvas, with their height controlled by the sin function. We can control the look of the wave by altering the xScale and yScale parameters.
function drawWave(color, waveHeight, xScale, yScale) {
  stroke(color);
  for (let i = 0; i < width; i++) {
    let y = yScale * sin(i * xScale) + waveHeight;
    line(i, height, i, height - y);
  }
}
Putting It All Together
In the draw function, we'll call the previously defined functions to draw the sun and waves:
function draw() {
  background("#e1d7bb");

  drawSun(width / 2, height / 3.3, 220);

  drawWave("#28636f", 200, 0.02, 30);
  drawWave("#1c4457", 130, 0.016, 12);
  drawWave("#0d1d38", 70, 0.02, 25);
}
You can see we called the drawWave function 3 times, with different parameters, to get different looks.

Extra: Animating the Sun and Waves
To animate the sun and waves, we'll use the sin function with slightly increasing inputs every frame. We'll define two new variables and update our functions accordingly.
let wavesStartOffset = {};
let sunRaysOffset = 0;
For the sun rays, we'll add a rotationSpeed parameter and update the drawSunRays function:
function drawSunRays(centerX, centerY, numberOfTriangles, distance, triangleSize, rotationSpeed) {
  for (let i = 0; i < numberOfTriangles; i++) {
    let angle = map(i, 0, numberOfTriangles, 0, TWO_PI);
    let x = centerX + cos(angle + sunRaysOffset) * distance;
    let y = centerY + sin(angle + sunRaysOffset) * distance;

    push();
    translate(x, y);
    rotate(angle + HALF_PI + sunRaysOffset);
    triangle(-triangleSize, triangleSize, triangleSize, triangleSize, 0, -triangleSize);
    pop();
  }
  sunRaysOffset += rotationSpeed;
}
For the waves, we'll use an object to control the speed of each wave:
function drawWave(color, waveHeight, xScale, yScale, offsetSpeed) {
  if (!(color in wavesStartOffset)) {
    wavesStartOffset[color] = 0;
  }

  stroke(color);
  for (let i = 0; i < width; i++) {
    let y = yScale * sin(i * xScale + wavesStartOffset[color]) + waveHeight;
    line(i, height, i, height - y);
  }
  wavesStartOffset[color] += offsetSpeed;
}
And there you have it!
You've successfully created and animated an abstract art piece with p5.js. Congrats!
Keep experimenting with different parameters to create unique effects. A few ways to make this art yours and learn along the way would be:
- change the sun radius and position
- adjust the number of triangles, the size and distance
- draw 10 waves instead of 3 and see how that looks
Like always, you can find the full code here:
Wrapping Up
Thank you for following along with this tutorial! If you have any questions, feedback, or just want to share your own creations, please feel free to leave a comment below. I’ll make sure to respond and help you out as best as I can.
Stay connected for more exciting tutorials and creative coding tips by subscribing to this blog. I really appreciate it!
Happy coding, and see you in the next tutorial!
To stay informed about future articles, feel free to subscribe. It’s free, and your support means a lot. Thank you!
Next tutorial
In the next tutorial we will explore how to animate an abstract art using tweening in p5.js. See you there!