Vibrant Digital Art: Creating a Bauhaus-Inspired Grid of Colorful Shapes with Code

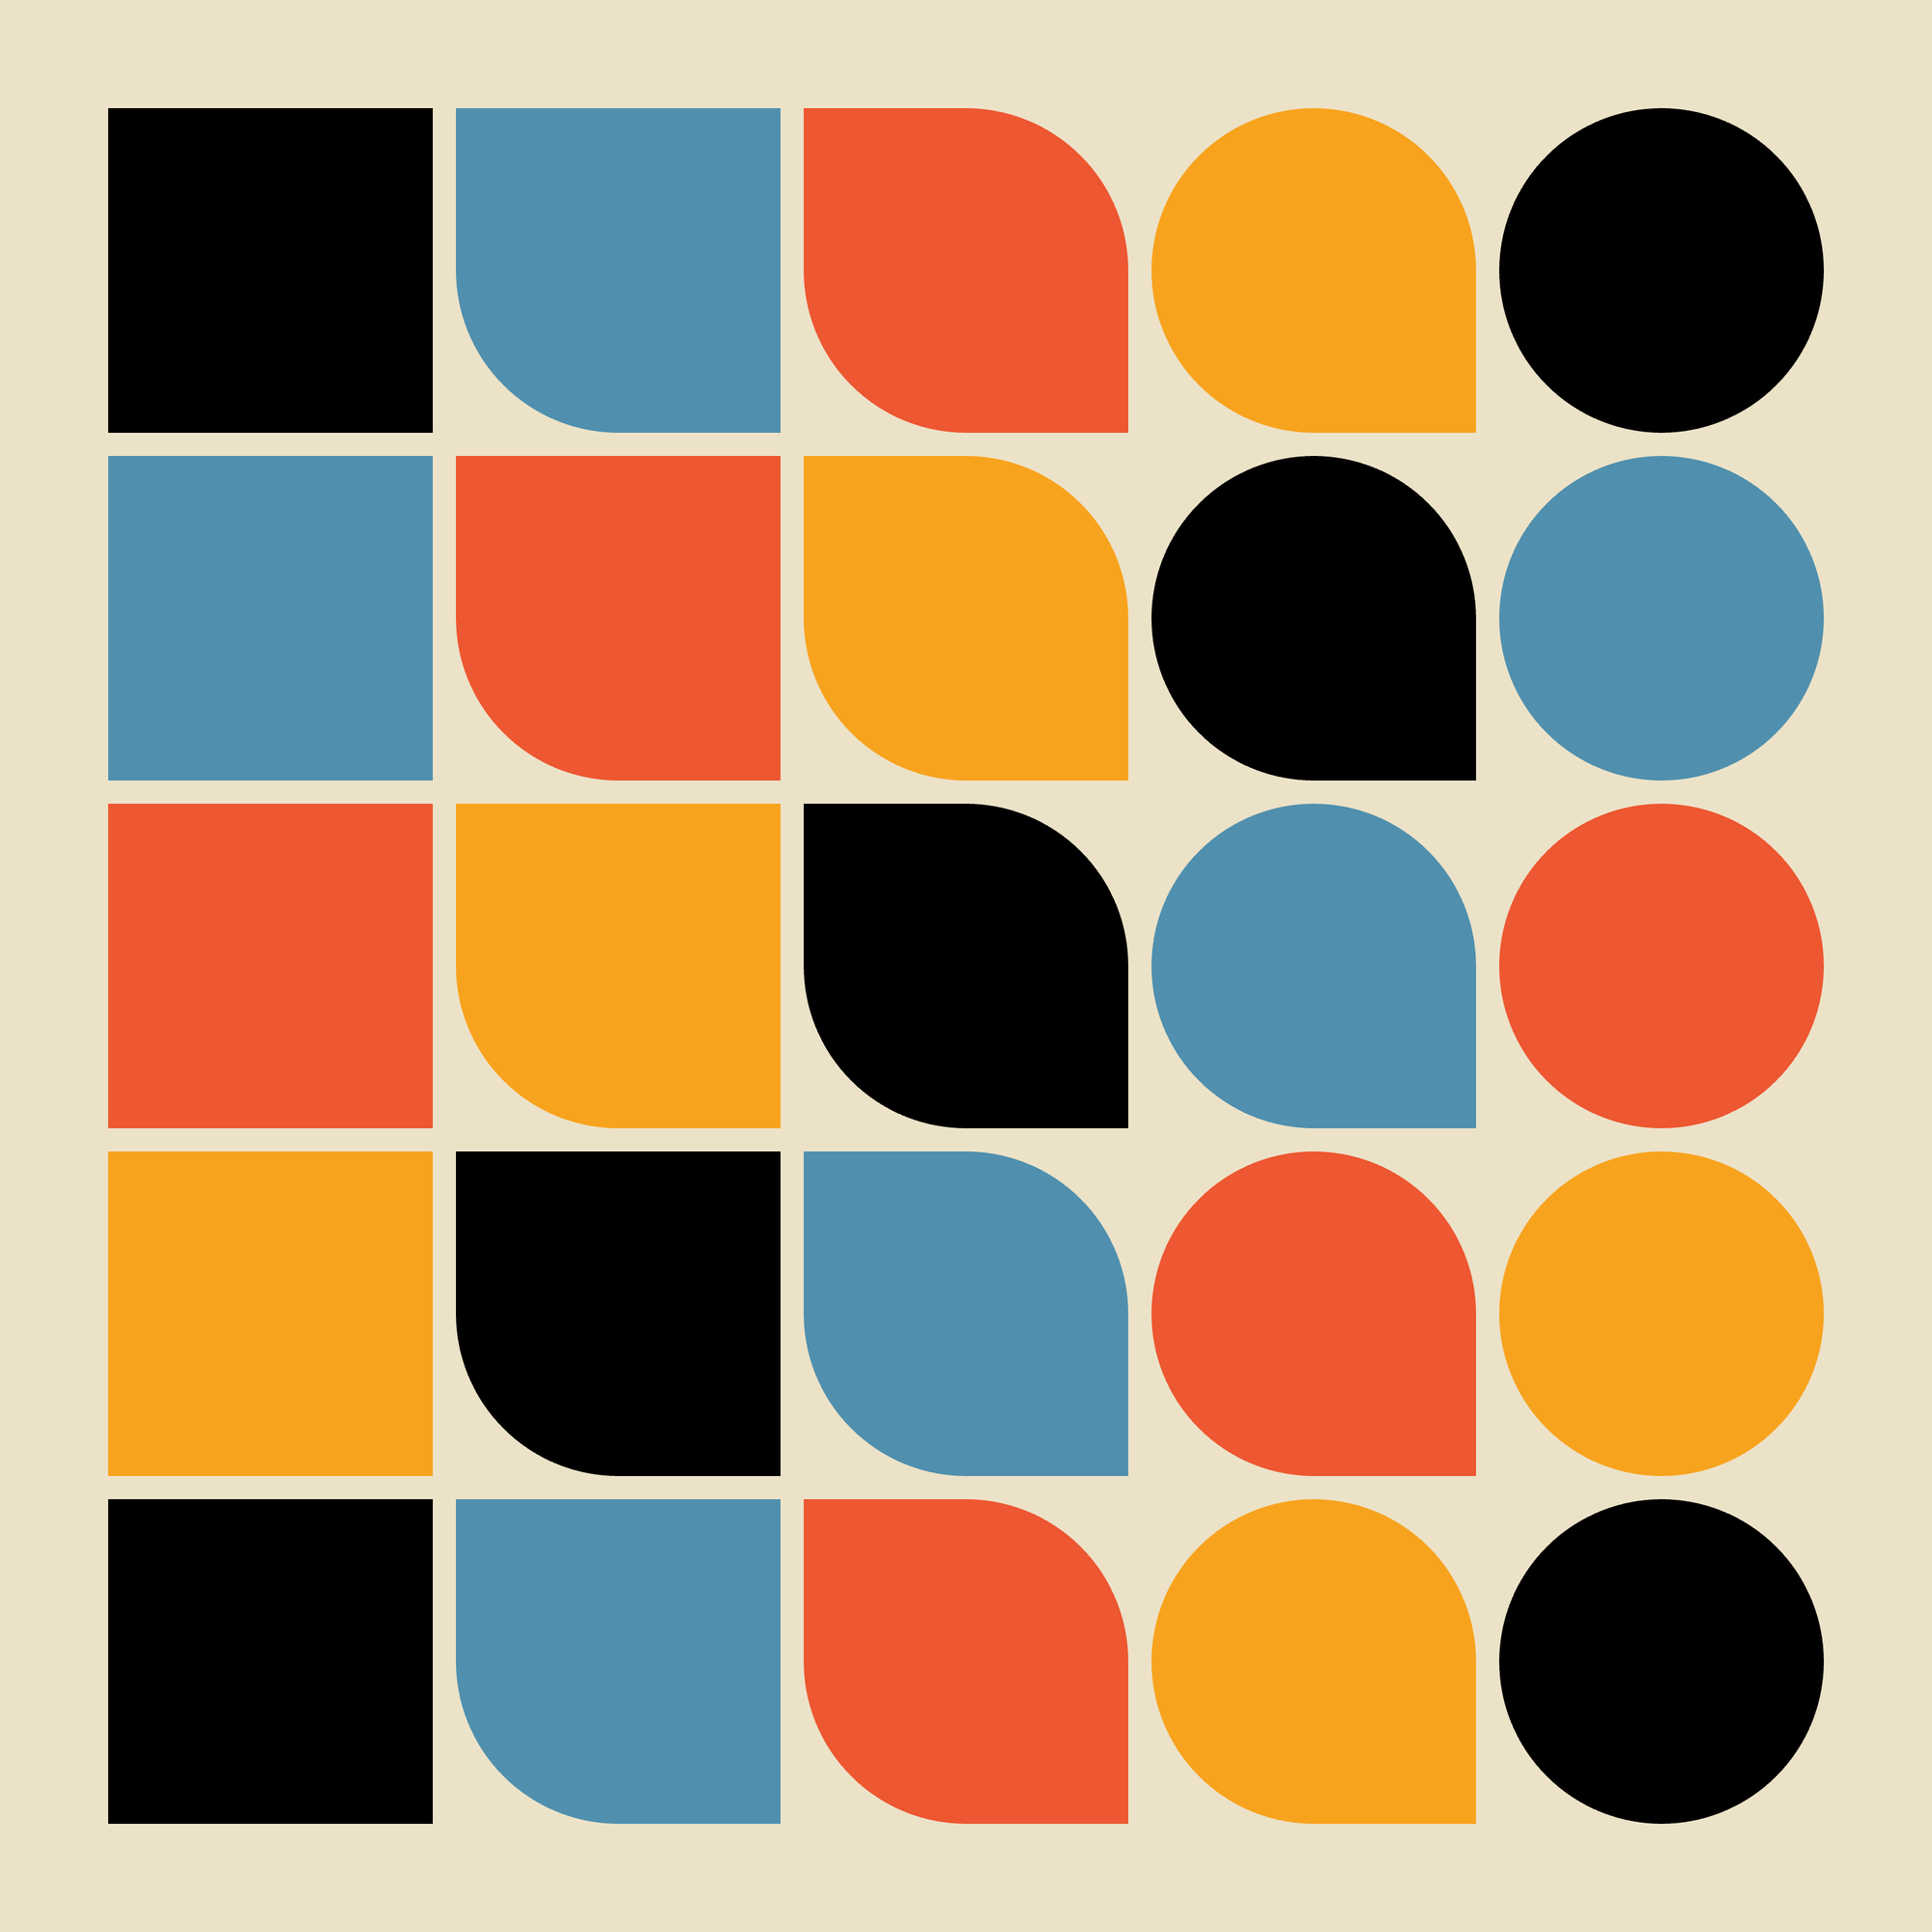
In this tutorial, I'll guide you through the process of creating a Bauhaus-inspired grid of colorful shapes using code. By the end of this tutorial, you’ll have a vibrant piece of digital art.
Starting with the Basics
First, let's look at the overall structure of our code. We’ll define a grid with a specific number of rows and columns, add margins, and set colors. We'll then draw rectangles with varying border radii to create an interesting visual effect.
Setting Up the Canvas
We start by defining our grid dimensions, margins, and colors. Here are the variables we'll use:
let rows = 5;
let cols = 5;
let verticalMargin = 40;
let horizontalMargin = 40;
let borderRadius = 40;

let cellWidth, cellHeight;
let verticalPadding, horizontalPadding;

let colors = ["#000000", "#5090ae", "#ed5731", "#f8a31e"];
Defining the Setup Function
In the setup() function, we create our canvas and calculate the dimensions of each cell in our grid. We also determine the padding within each cell:
function setup() {
  createCanvas(400, 400);
  cellWidth = (width - horizontalMargin) / cols;
  cellHeight = (height - verticalMargin) / rows;
  verticalPadding = cellHeight / 15;
  horizontalPadding = cellWidth / 15;
  noLoop();
}
Here, createCanvas(400, 400) sets up a 400x400 pixels canvas. The cellWidth and cellHeight are calculated by subtracting the margins from the total width and height, then dividing by the number of columns and rows, respectively. The padding values are a fraction of the cell dimensions, ensuring some space around the rectangles.
Drawing the Rectangles
The draw() function is where the magic happens. We set the background color, removed the stroke from shapes, and translated the origin point for easier drawing within the margins. We then use nested loops to draw the rectangles, applying different border radii based on the column index:
function draw() {
  background("#ece2c8");
  noStroke();
  translate(horizontalMargin / 2, verticalMargin / 2);

  for (let i = 0; i < rows; i++) {
    for (let j = 0; j < cols; j++) {
      fill(colors[(j + i) % colors.length]);

      let radius = getBorderRadius(j);
      rect(
        horizontalPadding / 2,
        verticalPadding / 2,
        cellWidth - horizontalPadding,
        cellHeight - verticalPadding,
        ...radius
      );

      translate(cellWidth, 0);
    }
    translate(-cols * cellWidth, cellHeight);
  }
}
Breaking Down the draw() Function
- First, we set the background color and disabled the stroke, so we don't have an outline for the shapes.
translate(horizontalMargin / 2, verticalMargin / 2);
Moves the origin point to account for the margins. Imagine the x-y axis like a graph where (0, 0) is the top-left corner.translate(x, y)moves the drawing tool to the coordinate (x, y) from the current origin. In this case, it shifts the origin to (20, 20), making it easier to draw within the margins.- The outer loop runs through each row, and the inner loop runs through each column.
fill(colors[(j + i) % colors.length])cycles through the color array.- The
await sleep(100)introduces a delay between drawing each rectangle. let radius = getBorderRadius(j)determines the corner radii based on the column index.rect()draws the rectangle with the specified dimensions and border radii.translate(cellWidth, 0)moves the drawing tool to the right bycellWidthpixels for the next column.- After completing a row,
translate(-cols * cellWidth, cellHeight)resets the x position and moves down bycellHeightpixels to start the next row.
Custom Functions
We also define one helper function: getBorderRadius.
function getBorderRadius(colIndex) {
  switch(colIndex) {
    case 0: return [0, 0, 0, 0];
    case 1: return [0, 0, 0, borderRadius];
    case 2: return [0, borderRadius, 0, borderRadius];
    case 3: return [borderRadius, borderRadius, 0, borderRadius];
    case 4: return [borderRadius, borderRadius, borderRadius, borderRadius];
    default: return [0, 0, 0, 0];
  }
}
getBorderRadiusreturns different border radius configurations based on the column index.
Conclusion
Congratulations! You've now created a Bauhaus-inspired grid of rectangles with varying border radii. This exercise not only helps in understanding the basics of shapes and loops in p5.js but also adds a creative twist to your coding journey.
Extra: Add Animation
As a little extra, let's make this art more dynamic by drawing each shape individually with a delay between them, so we can see the process and better understand how the two nested loops work.
To do this we will define a custom function, called sleep that pauses the execution for a specified duration, creating a visual delay effect.
function sleep(millisecondsDuration) {
  return new Promise((resolve) => {
    setTimeout(resolve, millisecondsDuration);
  });
}
Then, we have to add async in front of the draw() function definition so this becomes async function draw() and call the sleep function from inside the draw function. Add this call anywhere inside the nested loops, like this:
...
for (let i = 0; i < rows; i++) {
    for (let j = 0; j < cols; j++) {
      fill(colors[(j + i) % colors.length]);
      await sleep(100);

      let radius = getBorderRadius(j);
...
Now, run the code and you should get something like this

Experiment and Explore
Feel free to experiment by:
- Changing the number of rows and columns.
- Adjusting the margins and border radius.
- Adding more colors to the palette.
The full code can be found here:
Wrapping up
Thank you for following along with this tutorial! If you have any questions, feedback, or just want to share your creations, please feel free to leave a comment below. I’ll make sure to respond and help you out as best as I can.
Stay connected for more exciting tutorials and creative coding tips by subscribing to this blog. I really appreciate it!
Happy coding, and see you in the next tutorial!
Want to stay updated with new articles? Just hit subscribe — it’s completely free, and I’d really appreciate the support. Thanks a lot!
Next Tutorial
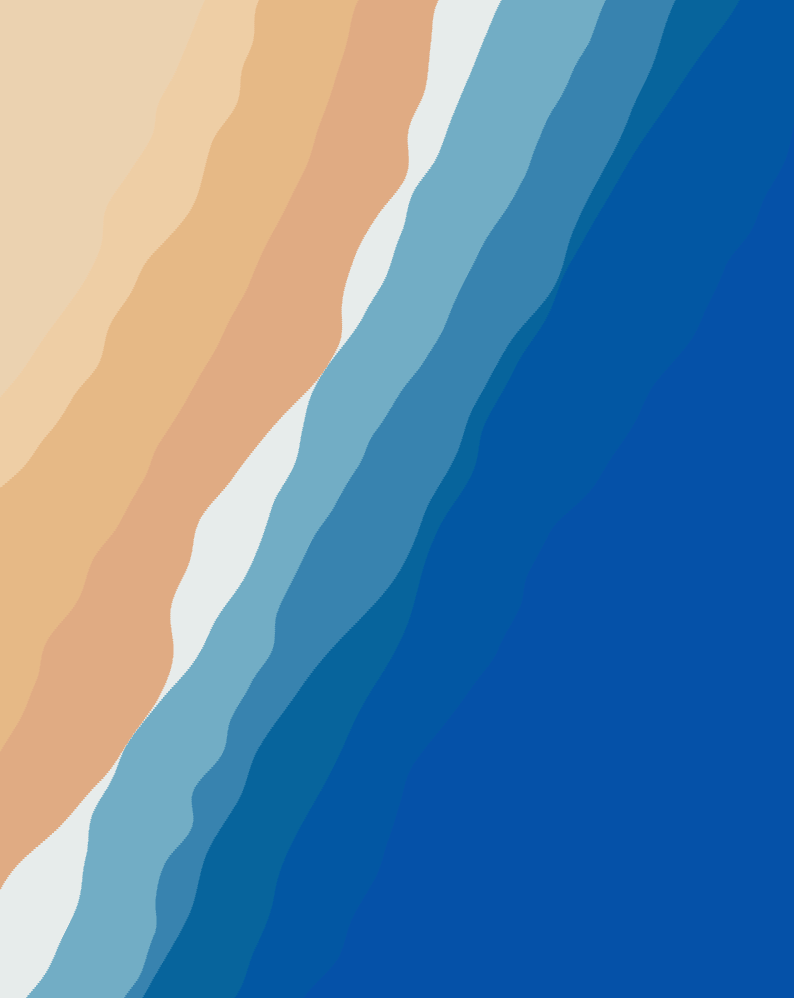
In the next tutorial, we’ll dive into creating a more complex piece of art using additional p5.js functions and exploring more programming concepts. We will create our first dynamic digital art with code, in which we will learn about noise, random and many more concepts.